BIOMARKERS
Deciphering Aging Biomarkers
The gap between individuals’ chronological and biological ages underscores the need for reliable aging biomarkers. These biomarkers, comprised of various biological parameters, serve to evaluate age-related changes, monitor physiological aging, and predict the onset of pathological conditions.
Clinical Biomarkers
Measurable health indicators commonly used in clinical settings or analyzed in accredited laboratories based on standardized methods, such as blood pressure readings, cholesterol levels, and HbA1c.
Physiological Biomarkers
Measurable characteristics related to the functioning of organs and systems within the body. Examples include changes in muscle mass and strength, bone density, cardiovascular function (VO2max), respiratory capacity, and cognitive function.
Cellular Biomarkers
Changes that occur within individual cells as a result of aging. This may include cellular senescence (the process by which cells stop dividing and become dysfunctional), alterations in mitochondrial function, and changes in cellular metabolism.
Molecular Biomarkers
Molecules in biological samples assessing aging-related changes, including inflammation markers like CRP, oxidative stress indicators such as ROS, and metabolic dysfunction markers like insulin resistance.
Genetic Biomarkers
Variations in genes related to aging and disease, such as changes in telomere length (e.g., TERT gene) and DNA repair mechanisms (e.g., BRCA1 gene).
Epigenetic Biomarkers
Changes in DNA or associated proteins regulate gene activity without altering the DNA sequence, like DNA methylation and histone modifications. Many new epigenetic clocks, including third-generation ones like Dunedin Pace, have emerged recently.
Behavioral Biomarkers
Lifestyle factors and behaviors influencing aging and health outcomes, including physical activity levels, dietary patterns, sleep quality, stress levels, and social connectedness.
Composite Aging Biomarkers
Combination of various measures like physical, cognitive, and clinical indicators (e.g., frailty indices) to assess overall health and aging, aiding in predicting health outcomes and evaluating interventions for healthy aging.
My Routine Tests
Daily
- Weight
- Calories & nutrients
- Sleep (Whoop)
- Resting heart rate
- Heart rate variability
- Blood pressure
Every 3 months
- Continuous glucose Monitoring
- HbA1c
- DEXA scan for body composition
Every 6 months
- DunedinPACE (pace of aging)
- Lipid panel
- Complete metabolic panel
Yearly
- Apolipoprotein
- Complete blood count
- hs-CRP
- Vitamin D, 25 hydroxy
- Cardiopulmonary exercise test (VO2max)
CLINICAL BIOMARKERS
METABOLIC & ENDOCRINE
| Biomarker | Baseline (May 2023) | Most Recent |
|---|---|---|
| HbA1c | 5.7 | 5.8 |
| Creatinine | 0.94 | 0.77 |
| Albumin | 4.3 | 4.4 |
| Alkaline Phosphatase | 40 | 64 |
| AST | 15 | 19 |
| ALT | 13 | 16 |
| TSH | 5.42 | 4.25 |
| Free T4 | 1.18 | |
| Insulin | <1.0 | |
| Vitamin D, 25-OH (ng/mL) | 91.2 |
LIPID
| Biomarker | Baseline (May 2023) | most recent |
|---|---|---|
| LDL-C | 119 | 82 |
| HDL-C | 95 | 104 |
| Triglyceride | 58 | 47 |
| Apo A1 | 199 | 228 ↑ |
| Apo B | 76 | 67 ↓ |
| Apo B/A1 Ratio | 0.38 | 0.29 ↓ |
| Lipoprotein (a) | <10 | |
| Omega-3 Index | 6.6% | |
| Omega 6:Omega 3 Ratio | 3.4:1 |
BLOOD CELLS
| Biomarker | Baseline (May 2023) | most recent |
|---|---|---|
| WBC | 5.5 | 4.3 |
| Hemoglobin | 13.5 | 13.7 |
| RDW | 12.7 | 14.3 |
INFLAMMATION
| Biomarker | Baseline (May 2023) | most recent |
|---|---|---|
| hs-CRP | <0.3 | 0.37 |
| Homocysteine | 7.0 |
PHYSIOLOGICAL BIOMARKERS
BODY COMPOSITION (DEXA SCAN)
| Biomarker | Baseline (Oct 2023) | most recent |
|---|---|---|
| Body Fat % | 20.5% | 14.8% |
| Total Mass (lb) | 104.3 | 103.5 |
| Fat Mass (lb) | 21.4 | 15.3 |
| Lean Mass (lb) | 78.5 | 83.8 |
| Visceral Fat (cubic inch) | 1.32 | 3.3 |
| Bone Mineral Density (g/cm2) | 1.133 | 1.094 |

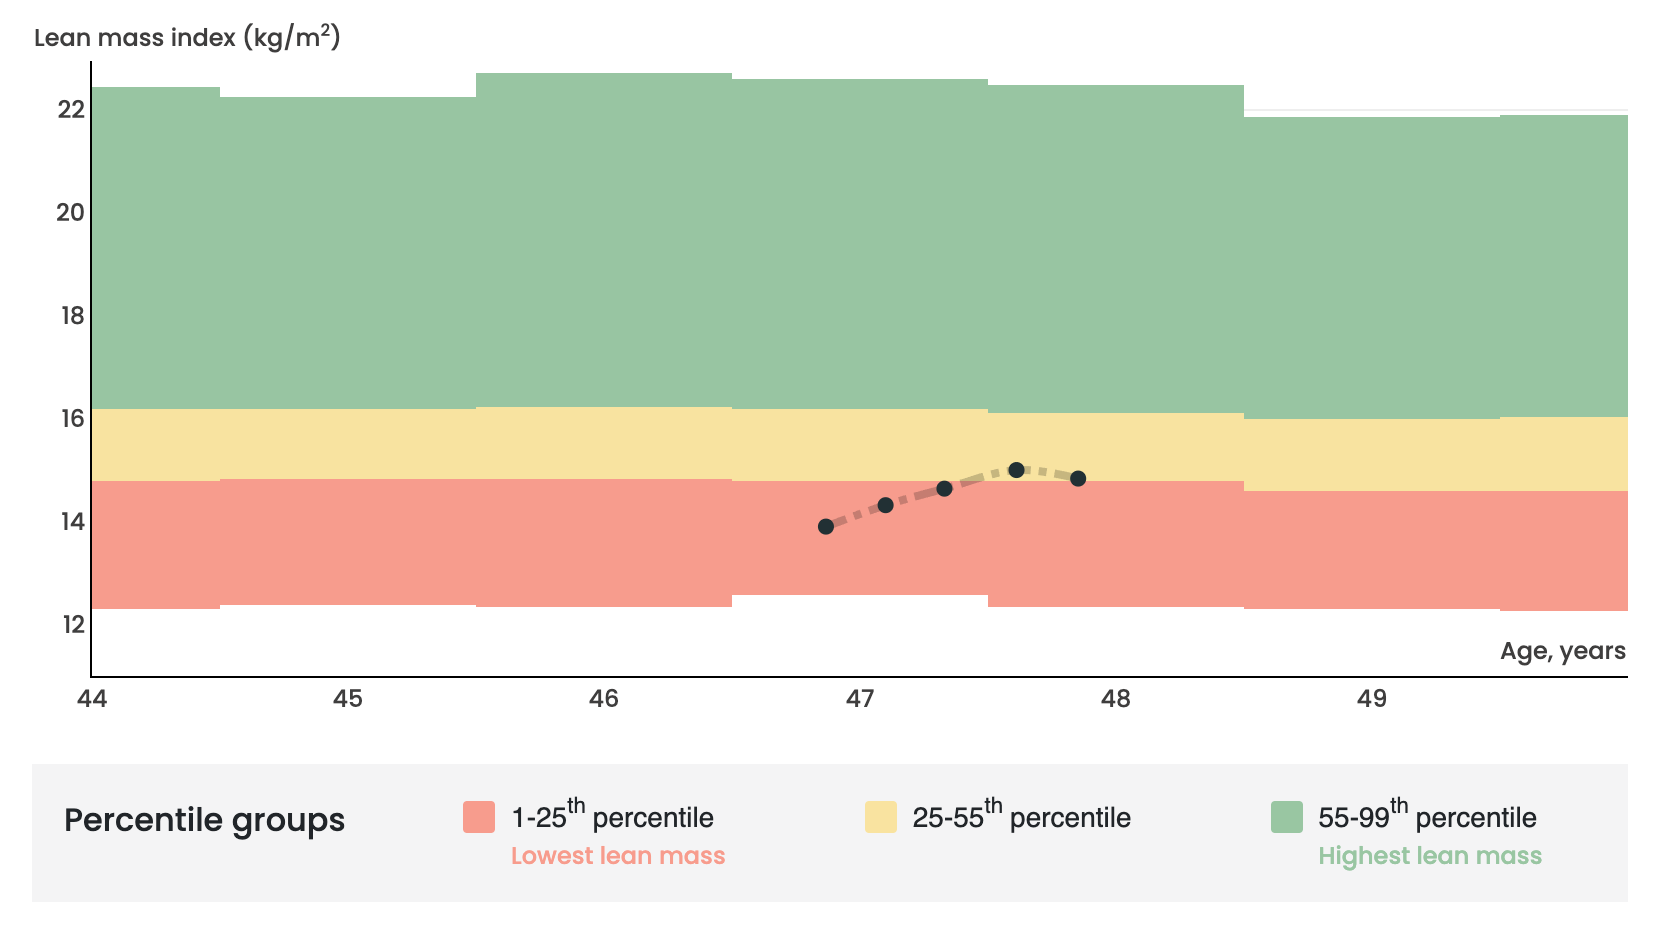
My Lean Mass Index (or LMI) over time compared to others in my selected gender & age reference group.

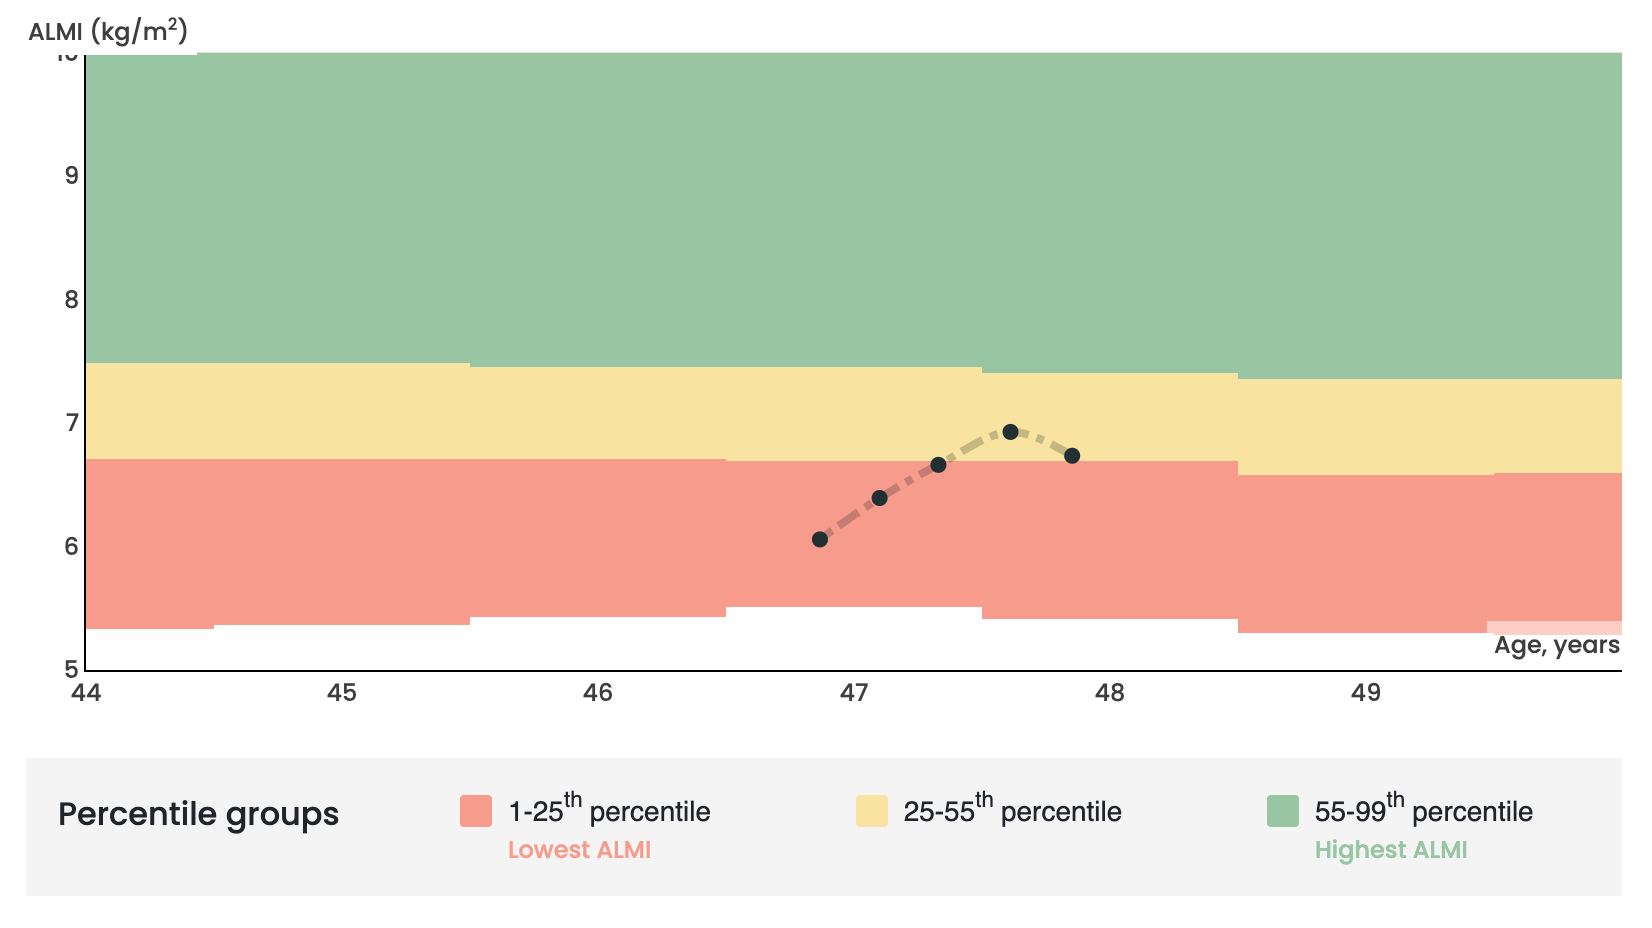
My Appendicular Lean Mass Index (or ALMI) over time compared to others in my selected gender & age reference group.
CARDIORESPIRATORY FITNESS
| Biomarker | Baseline (May 2023) | Most recent |
|---|---|---|
| VO2max (mL/kg/min) | 38.9 | |
| % Predicted VO2max | 135% | |
| HR max (bpm) | 171 | |
| % Age Predicted HR max | 98% | |
| Max Power (watt) (bike) | 145 | |
| Aerobic Threshold (mL/kg/min) | 35.4 |
HR & BP
| Biomarker | Baseline (Oct 2023) | current |
|---|---|---|
| Heart Rate Variability | 33 | 39 |
| Resting Heart Rate (bpm) | 58 | 56 |
| Blood Pressure (mmHg) | 95/63 | 91/52 |
GENETIC & EPIGENETIC BIOMARKERS
| Biomarker | Baseline (Sep 2023) | Previous | Most recent |
|---|---|---|---|
| DunedinPACE | 0.82 | 0.8 | 0.76 |
| Telomere Length (Kb) | 6.5 | 6.68 | 7.1 |
| Telomere Length Percentile | 6th | 11.85th | 32.26th |
BEHAVIORAL BIOMARKERS
SLEEP
| Biomarker | Baseline (Oct 2023) | Last 30-day Average |
|---|---|---|
| Sleep Performance | 87% | 95% |
| Sleep Consistency | 87% | 90% |
| Restorative Sleep | 47% | 48% |
| Sleep Efficiency | 87% | 88% |

